







Scientific Software, Data Tools & Dashboards
- Interactive scientific applications
- Automated data & analysis workflows
- Dashboards & monitoring systems
We design and build bespoke scientific software for research groups, consortia, and technical projects. This can range from focused computational tools and automated analysis workflows to interactive dashboards, database-backed applications, and multi-user systems that integrate data, scientific calculations, and reporting in one place.

Scientific software built around your research problem
The software can be as focused or as extensive as the project requires, from an internal utility used by one research group to a multi-user application with automated data ingestion, computational services, databases, and public-facing outputs.
Interactive scientific applications
Purpose-built web applications for exploring data, running calculations or models, comparing scenarios, applying scientific rules, and returning interpretable or downloadable outputs.
Data platforms, dashboards & monitoring systems
Systems that combine data sources, derived indicators, maps, charts, status information, alerts, and drill-down views in a single research interface.
Automated analysis & processing systems
Reproducible pipelines that retrieve or receive data, validate and transform it, run analyses, update derived products, and generate outputs on a schedule or when new data arrive.
Research software, APIs & computational backends
Reusable computational services, APIs, model runners, database or search backends, batch tools, and internal utilities that can operate independently or support a user-facing application.
Some of our clients

Software that gets the science right
Research software sits between methods and results. It may encode a published algorithm, combine several data products, derive metrics from model output, classify observations, or apply project-specific decision rules. Choices made during implementation can materially affect the results, so we treat specification, provenance, validation, and traceability as core software requirements.
- Translate methods, equations, and decision rules into explicit computational steps that can be inspected and tested.
- Preserve data semantics and provenance across specialist inputs, joins, transformations, derived variables, reference periods, and missing-data rules.
- Validate critical calculations and transformations against reference implementations, published examples, known test cases, or independent checks where practical.
- Make assumptions, parameters, dependencies, and processing choices explicit so analyses can be repeated and reviewed.
- Build in input validation, failure handling, logging, and automated tests where they add value, rather than assuming ideal data or perfect usage.
- Design outputs around scientific interpretation, including uncertainty, comparisons, diagnostics, and provenance where relevant.
From research question to usable software
Data → method → validation → software
Research question & data
Define data sources, users, outputs, and scientific constraints.

Methods & implementation
Turn equations, rules, or analysis steps into testable code.
Validation & reproducibility
Check results, assumptions, edge cases, and dependencies.
Usable tool or workflow
Package the analysis for repeatable use, sharing, or deployment.
Scientific dashboards that do more than display charts
Many projects already contain the ingredients of a dashboard: recurring data imports, scripts that regenerate the same figures, spreadsheets used to track thresholds, and results circulated manually. A bespoke dashboard can turn that fragmented workflow into a single application that ingests data, runs the required processing, stores derived results, and exposes the current state of the project through interactive views.
Bring data and calculations together
Combine APIs, databases, instrument output, model results, files, and project-specific calculations in one controlled workflow instead of maintaining parallel analysis products.
Keep results current
Run scheduled or event-driven updates, quality checks, derived calculations, maps, figures, summaries, and alerts as new data become available.
Explore the data interactively
Filter datasets, inspect individual records or locations, change parameters or reference periods, compare scenarios, and move between overview and detailed views.
Give everyone the same research view
Provide collaborators, clients, decision-makers, or the public with one up-to-date source of results rather than circulating static plots, spreadsheets, or manually updated reports.
Why build a bespoke system?
General-purpose dashboard platforms such as Tableau, Power BI, or Grafana can become restrictive when the application itself needs to perform scientific work. A bespoke system lets the data model, calculations, user controls, permissions, storage, and deployment follow the research problem instead of forcing the workflow into a predefined platform structure.
Custom scientific logic
Run project-specific algorithms, models, classifications, optimisation routines, or decision rules directly within the application.
Specialist data & integration
Work with non-standard scientific formats, large multidimensional datasets, external APIs, databases, instruments, or existing analysis code.
Purpose-built interaction
Design controls, drill-downs, scenario comparisons, saved analyses, and outputs around the scientific questions users actually need to investigate.
Control over architecture & deployment
Choose how data are stored, where the system runs, how users authenticate, how components communicate, and how the application can be extended later.
What could a bespoke system do for your project?
The starting point is often not a request for software, but a research workflow that has become difficult to manage, reproduce, automate, or share. Typical examples include:
Automated monitoring
Ingest observations, instrument feeds, model output, or external data; apply quality checks and calculations; update indicators; and issue alerts when defined conditions are met.
Interactive model exploration
Let users change parameters, run calculations or scenarios, compare outputs, and inspect results without editing source code or rebuilding plots manually.
Research database interfaces
Search, filter, annotate, and analyse structured datasets through a purpose-built interface, with cohort definition, indexing, validation, or derived statistics where required.
Collaborative analysis portals
Provide authenticated workspaces with user roles, shared datasets, saved analyses, reproducible configurations, downloadable outputs, and project-specific reporting.
Scientific assessment tools
Translate methodological guidance, scoring systems, technical criteria, or decision logic into transparent workflows with consistent evaluation and explanatory results.
Public data products
Turn project data or outputs into accessible web applications with interactive maps, charts, search, downloads, automated updates, and clear provenance.
Selected scientific tools & dashboards
We have developed a small set of relatively compact public tools in-house to showcase selected approaches, including automated data pipelines, interactive analysis, database-backed search, and rule-based evaluation. Client-commissioned systems can be substantially more specialised and complex, but are generally confidential.
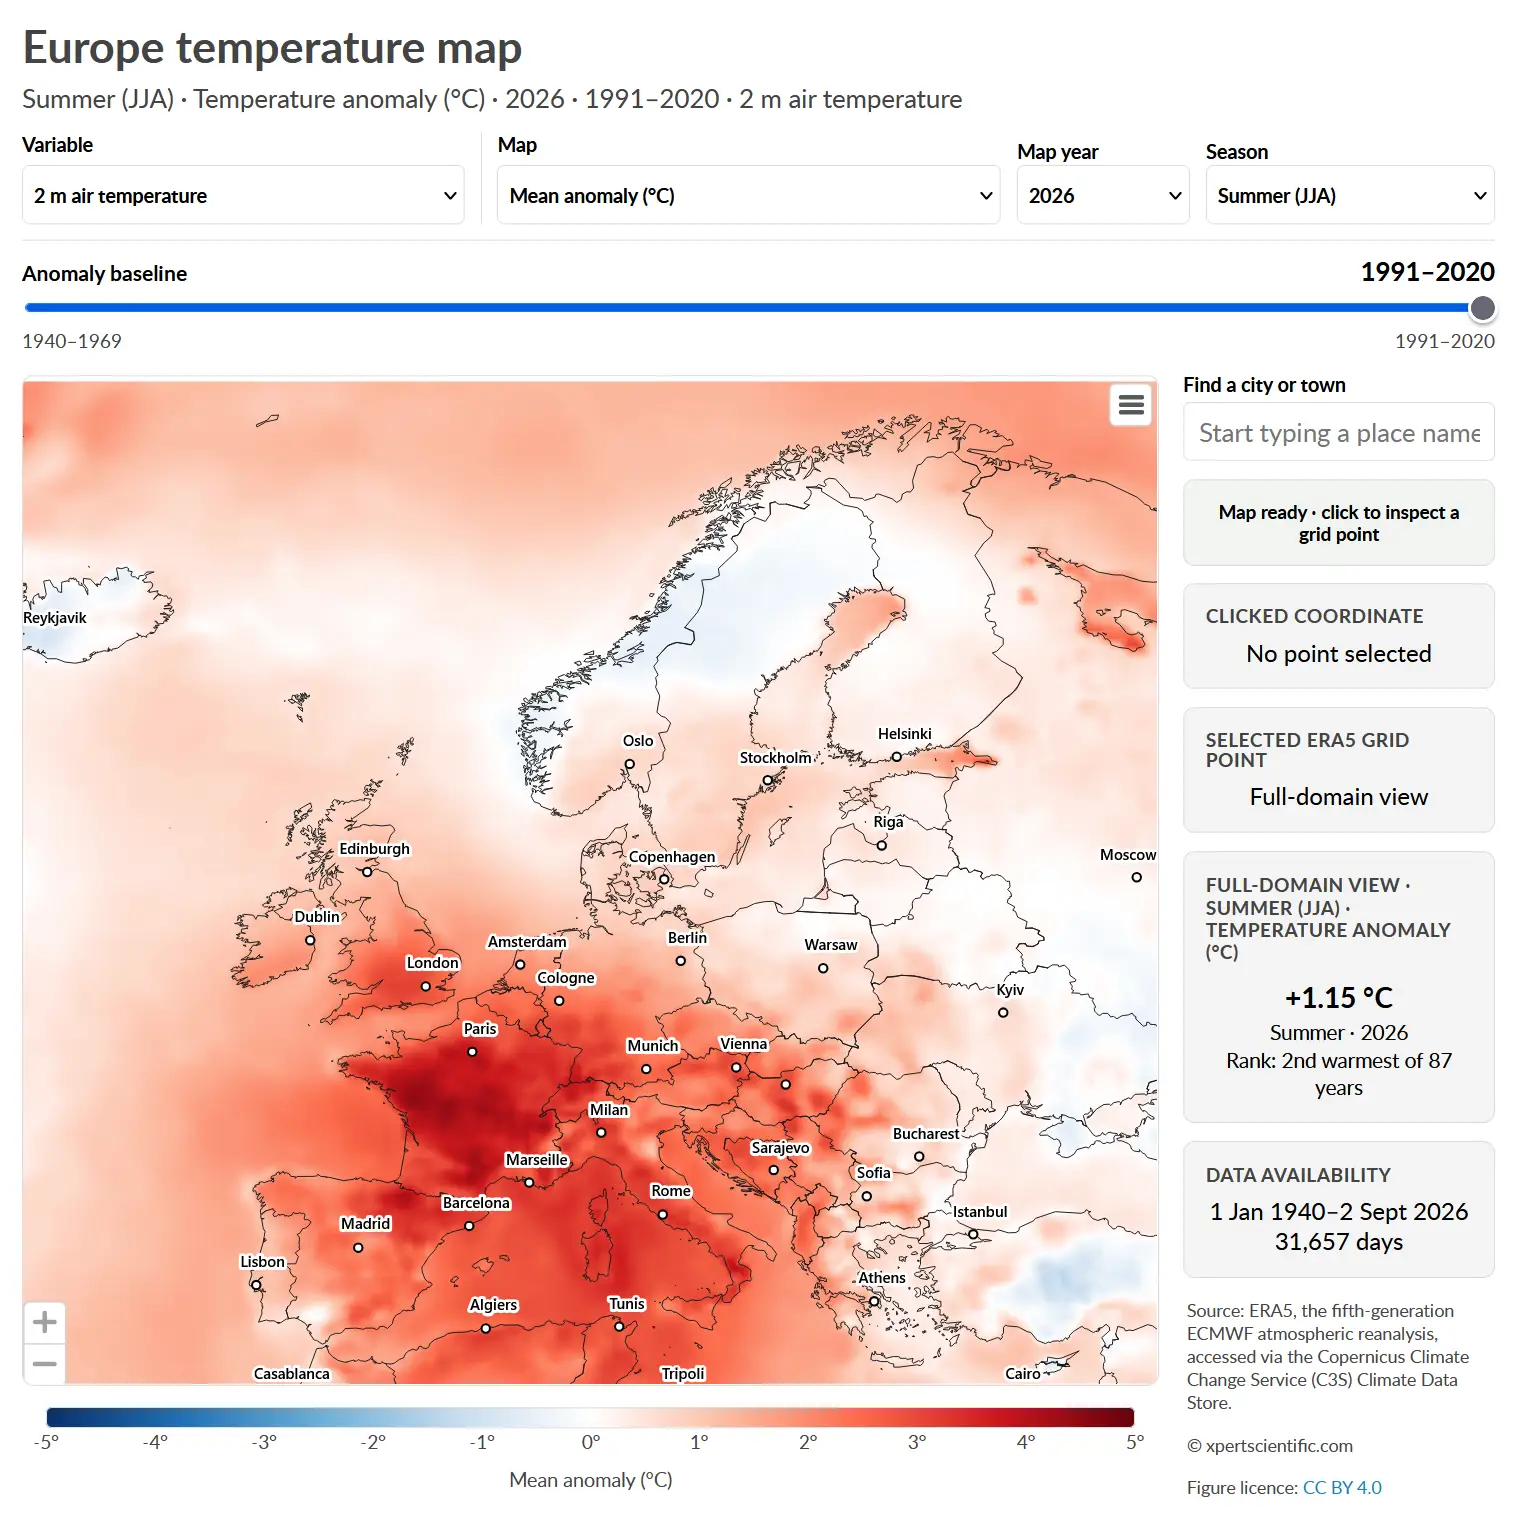
Automated data systems
Climate-data monitoring, processing & visualisation
The Europe ERA5 Climate Tracker and Barcelona Climate Tracker illustrate two complementary scientific-data workflows: one based on large gridded reanalysis datasets and the other on local observational records. Both combine automated updating, derived historical comparisons, and interactive visualisation.
- Automated acquisition and scheduled updating of external scientific data
- Processing of historical baselines and derived statistics
- Interactive maps, time-series views, rankings, and comparisons
- Monitoring, error handling, and reproducible update workflows
Database-backed research applications
Search, filtering, benchmarking & structured scientific data
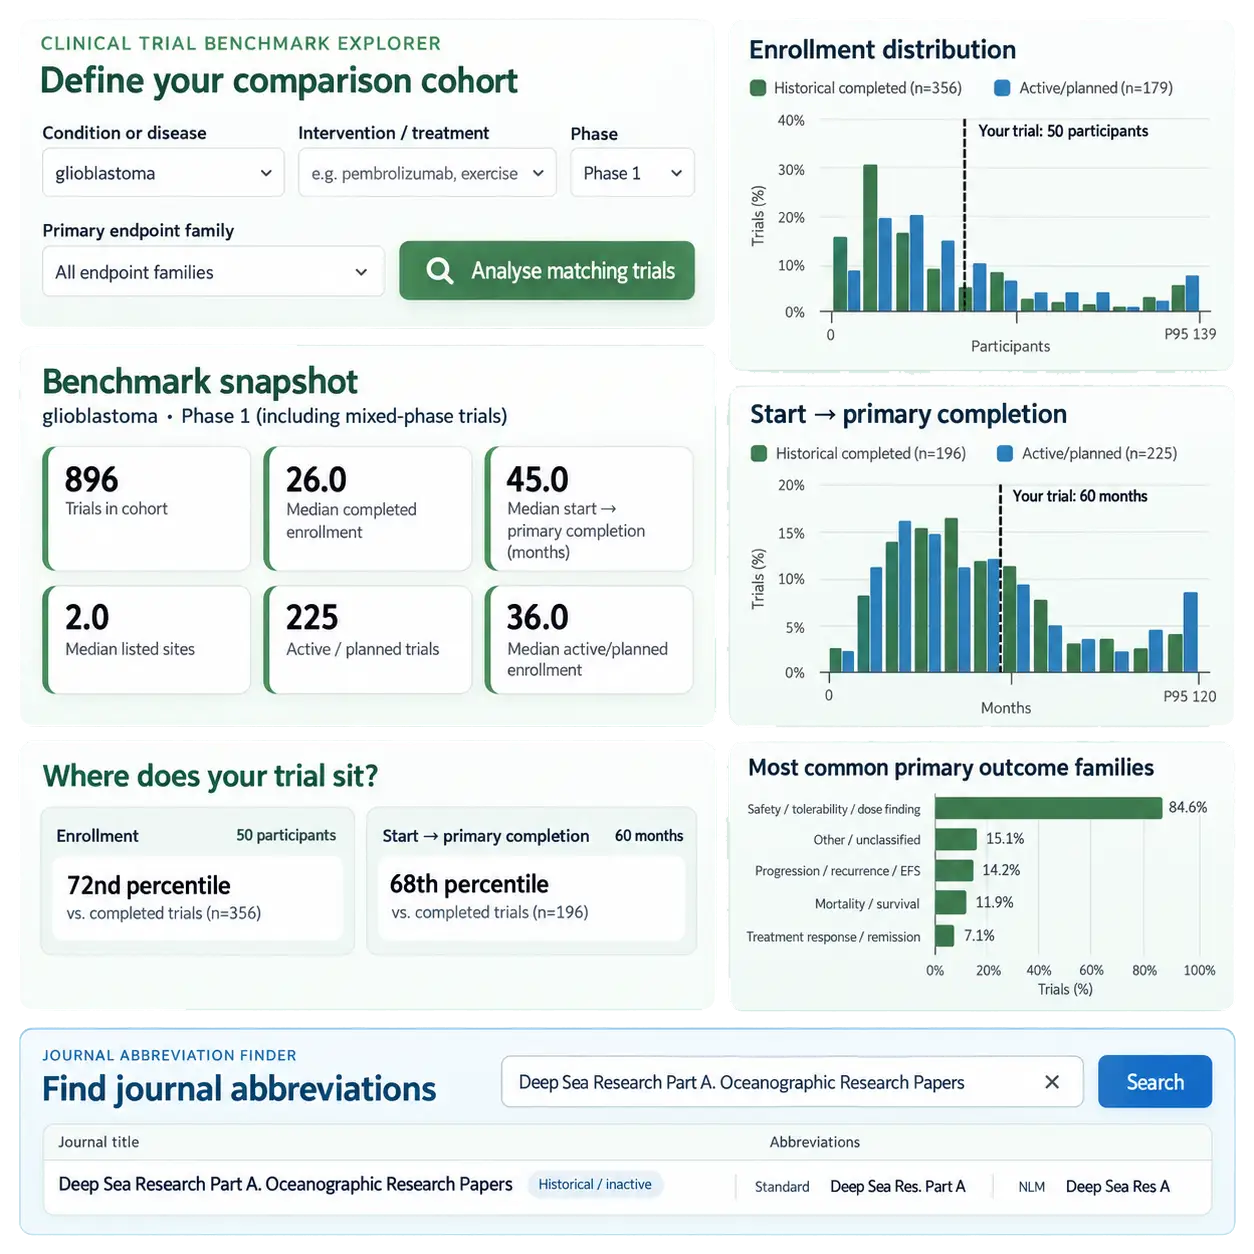
The Clinical Trial Benchmark Explorer and Journal Abbreviation Finder demonstrate database-backed applications that turn large structured datasets into fast, focused research interfaces. The emphasis is on efficient retrieval, transparent filtering, and useful derived outputs rather than simply displaying records.
- Structured scientific databases and searchable indexes
- Fast search, filtering, autocomplete, and query interfaces
- On-demand statistical summaries and benchmark calculations
- Public-facing interfaces with validation and sensible usage controls
Rule-based scientific applications
Structured checks, guidance & reproducible assessments
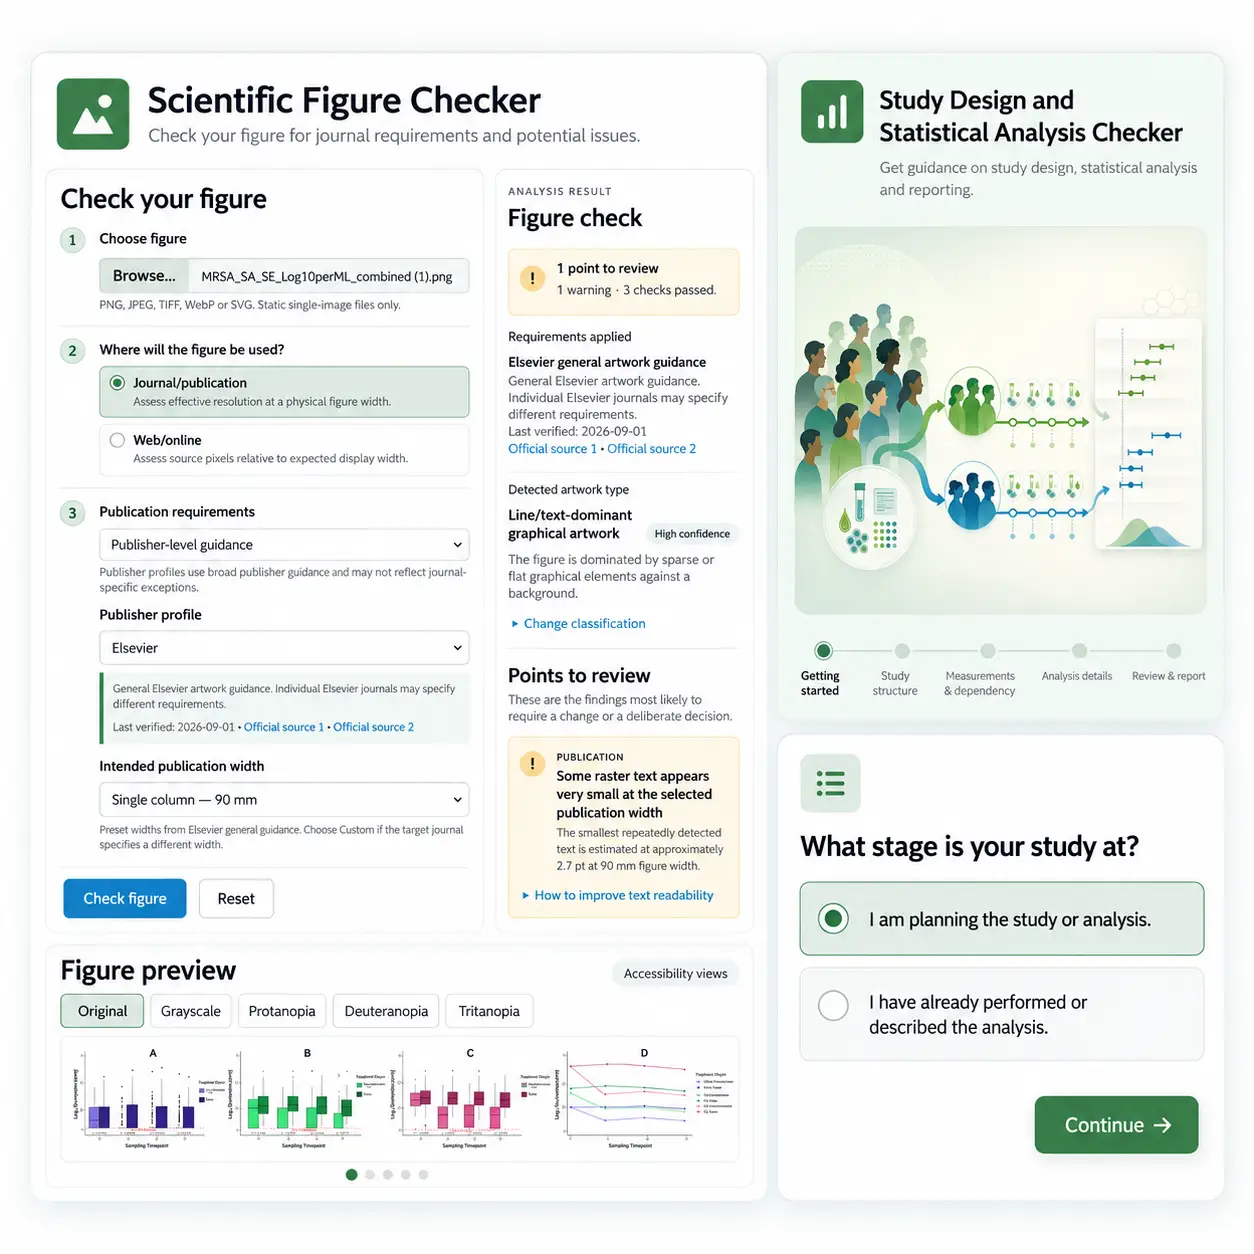
The Scientific Figure Checker and Study Design Checker show how technical guidance and methodological rules can be translated into structured interactive applications. These projects combine user input, deterministic evaluation logic, validation, and explanatory outputs.
- Formalisation of technical or methodological guidance into explicit rules
- Input validation and structured evaluation workflows
- Consistent and reproducible assessments and scoring
- User-facing explanations that connect results to the underlying requirements
How we develop research software
Custom software projects are easiest to control when the scientific workflow is specified before the full application is built. We identify the parts that carry the greatest scientific or technical risk, prototype them early, and define how they will be tested before proceeding to the full implementation.
Scientific specification
Define the data sources, methods, calculations, outputs, user roles, validation criteria, dependencies, and likely failure conditions before committing to the full build.
Risk-first prototype
Implement the most uncertain calculation, data path, or user interaction early so the critical assumptions can be tested before time is spent polishing the full application.
Validation & system testing
Check numerical results, transformations, edge cases, expected behaviour, and failure modes using reference datasets, independent calculations, and automated tests where appropriate.
Deployment & continuity
Deliver documented source code and configuration, deploy the system where required, and plan for logging, backups, updating, maintenance, and future extension where relevant.
Technologies, data & deliverables
The technical stack follows the scientific and operational requirements. A public data product, an internal computational service, and a collaborative analysis portal may require very different architectures.
Tools, languages & data
Work may involve Python, R, MATLAB, PHP, JavaScript, SQL and, where needed, existing C++ or Fortran code; CSV/JSON, NetCDF/HDF, SQL databases and APIs; interactive charts and maps; Linux automation; and Git-based workflows.
What we can hand over
Depending on scope, deliverables can include documented source code, standalone tools, reusable modules, web applications, APIs and computational backends, databases and search interfaces, automated processing jobs, authentication and permissions, report generation and data export, audit trails or provenance logs, validation tests, deployment configuration, technical documentation, and optional maintenance.
Discuss a scientific software or data-tool project
Tell us what the workflow does now, what data and calculations it depends on, who needs to use it, and what you would like to automate or make accessible. We can assess the likely scope, identify the technically important parts, and propose an appropriate development approach.
Trusted by Publishers, Societies, and Researchers Worldwide
Selected Publishers & Societies

Selected Client Affiliations



 Make a Payment


 Buy Credit