
Modelling Projects — Numerical Simulation & Scientific Computing
We design and run numerical models to turn complex systems into testable, reproducible simulations — from Random Walks and Monte Carlo simulations to infectivity modelling, particle tracking, optical ray tracing and turbulence. Our PhD scientists deliver robust code, meaningful visuals, and decision-ready outputs.

With 150+ years of combined modelling experience across natural & engineering sciences, life & medical sciences, and environmental & social sciences, we build bespoke models, validate them against data, and hand over clean, documented deliverables.
Simulation & Modelling Services
![]()
- Build bespoke numerical models (ODE/PDE, stochastic and agent-based).
- Set up and run simulations (Lagrangian/Eulerian, particle tracking, data assimilation).
- Calibrate, validate and benchmark models against observations or lab data.
- Optimise and accelerate existing code; profiling and algorithmic speed-ups.
Tooling & Languages
![]()
- MATLAB, Fortran, C++, Python, and R
- NetCDF/HDF data handling
- Git-based workflows
- Linux/Windows deployment
- We deliver documented code, notebooks, and publication-ready figures/videos.
Application Domains
![]()
- Marine & environmental systems (coastal transport, ocean optics, biogeochemistry).
- Life & medical sciences (biostatistics, biomarker dynamics, risk modelling).
- Genomics & phylogenomics (gene order, outlier detection, ancestral reconstruction).
- Physics & engineering (optics, turbulence, algorithm design and benchmarking).
How We Work
![]()
- Reproducible workflows (version-controlled code, annotated notebooks, clear hand-over).
- Transparent assumptions and sensitivity analyses.
- Iterative milestones with visual checkpoints (figures/videos) for fast feedback.
- Small-to-medium projects delivered on our in-house hardware.
Some of our clients

Recent projects
Selected modelling work includes:
- Monte Carlo simulations and random walks in biology.
- Optical ray tracing through freely falling raindrops.
- Photosynthesis modelling in phytoplankton (incl. photo-acclimation & inhibition).
- Ocean modelling: 3D at 1/4° resolution with realistic bathymetry and external forcing/data assimilation.
- Particle tracking models in 1D and 3D.
- Turbulence modelling via Kinematic Simulation.
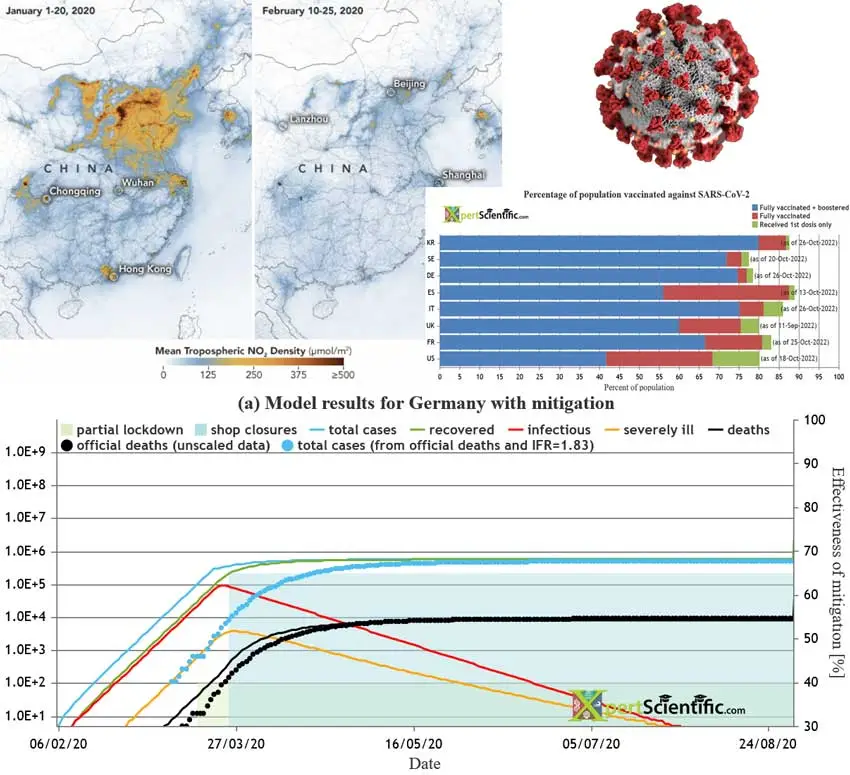
- COVID-19 monitoring & scenario analysis (2020): daily country-level tracking of cases, testing, doubling times, CFR/IFR, and simple epidemiological fits; see the project legacy page.
- Parasite infectivity modelling.
- Phylogeny reconstruction on large genomic datasets; marker selection, molecular dating and ancestral states.
- Structural genomics: evolution of genomic content (TEs, repeats, genes) and organisation (rearrangements).
- DMS cycle modelling to corroborate ship-based observations in the Western Mediterranean.
- Optimisation and inverse problems (least squares, inversion).

Particle tracking in a coastal embayment
Evolution of two particle clouds in a shallow Mediterranean estuary, forced by wind and freshwater inflow, using a Random Walk approach from Ross and Sharples (2004).
Kinematic Simulation (2D) of turbulence
2D Kinematic Simulation of turbulence following Fung and Vassilicos (2003). Particles with distinct colours visualise turbulence mixing.
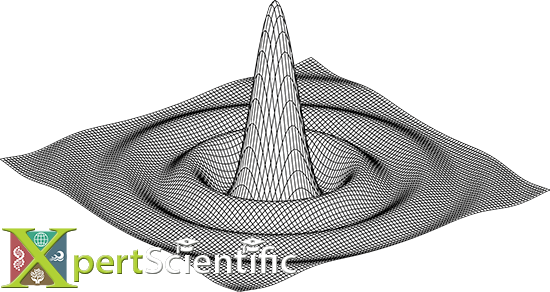
Fraunhofer diffraction at a circular aperture
Electric-field amplitude at the detector for Fraunhofer diffraction at a circular aperture (solved using Runge–Kutta methods).
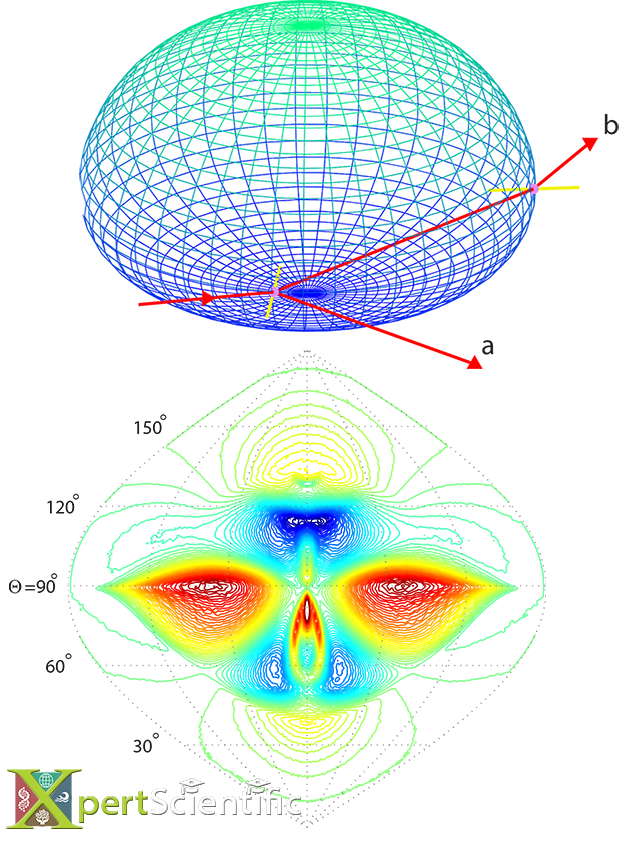
Optical ray tracing
Ray tracing through a free-falling 3 mm raindrop. Top: path, surface normals (yellow), reflected (a) and twice-refracted forward-scattered (b) rays. Bottom: difference between y- and z-polarised intensities in the forward hemisphere, using the Monte Carlo model of Ross and Bradley (2002).
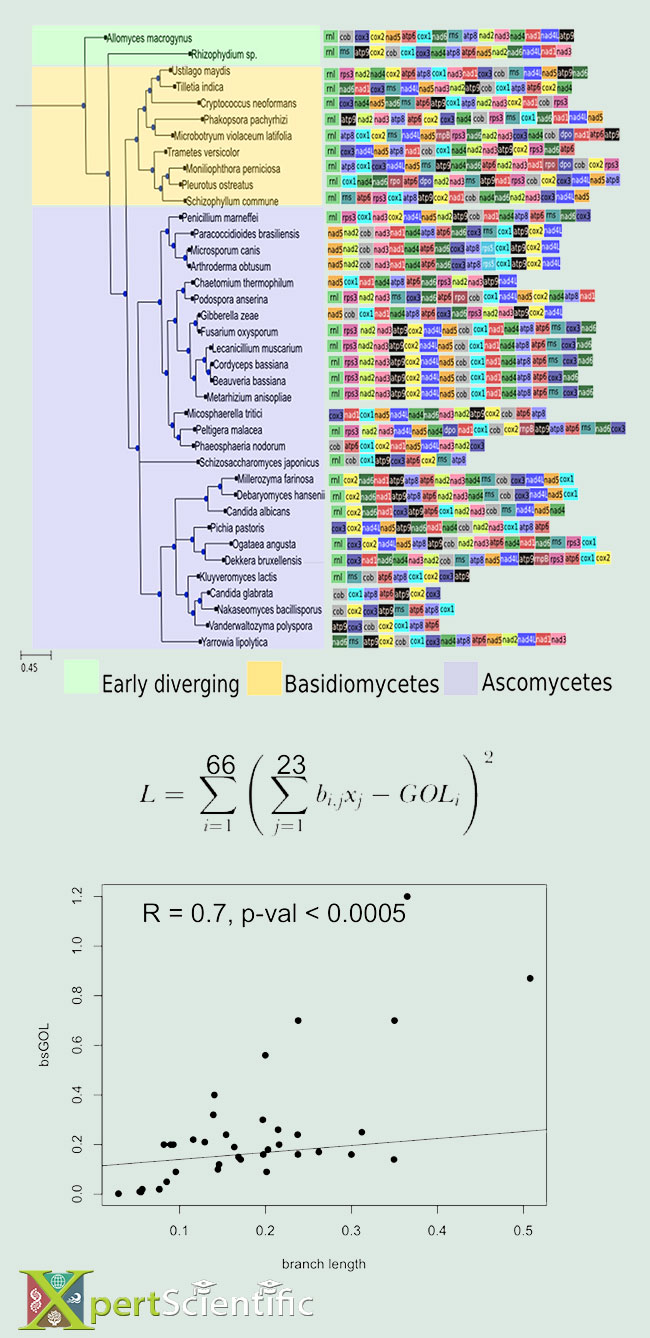
Modelling gene order loss
Gene order loss (GOL) from mitochondrial genes in a large fungal clade. The gene order in each species is represented by a set of coloured boxes. GOL can be modelled, based on the distances between species (given by branch lengths), but also from the tree topology.
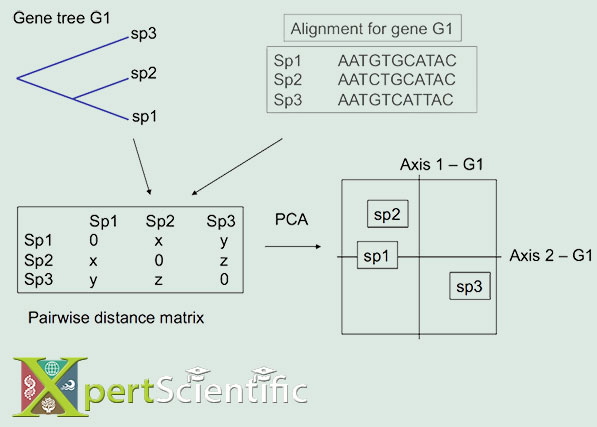
Multivariate analysis
A graphical multivariate approach to detect concordant and discordant (outlier) species in a topology. Pairwise tree distances → PCA → projection of separation axes onto a single plane for rapid visualisation.
Coronavirus modelling
During the peak of the COVID-19 pandemic in 2020, we monitored the outbreak and shared graphs and brief analyses for selected countries, tracking cumulative cases, doubling times, testing volumes, fatalities, recovered cases, and indicative levels of herd immunity (see the project legacy page).