







Long-term temperature and precipitation trends in the reconstructed Barcelona climate series (1780–2025)
by Oliver N. Ross, PhD
Founder and Principal Scientist, XpertScientific, Barcelona, Spain
August 2026
DOI: 10.5281/zenodo.22099932
About this case study. This independently developed case study illustrates XpertScientific’s approach to focused scientific data-analysis projects. It demonstrates source verification, data preparation, statistically robust trend estimation, uncertainty quantification, sensitivity analysis, scientific visualisation, and technical reporting.
The analysis is presented as an example of our scientific consulting capabilities rather than as a comprehensive or peer-reviewed assessment of climate change in Barcelona. The source data are publicly available, whereas the analytical code and associated workflow are proprietary to XpertScientific.
For current services, see our Science Consulting and Modelling Projects pages.
Related interactive tool: Explore the Barcelona Climate Tracker, which compares recent daily mean temperatures and precipitation at Fabra Observatory with historical ranges and selectable 30-year climatological baselines.
Ross O.N. (2026). Long-term temperature and precipitation trends in the reconstructed Barcelona climate series (1780–2025). XpertScientific Scientific Data Analysis Case Study. Barcelona: XpertScientific. DOI: 10.5281/zenodo.22099932. Available from: https://xpertscientific.com/barcelona-climate-data-analysis-case-study/.
Abstract
Barcelona has unusually long reconstructed and homogenised climate records, with monthly temperature data extending back to 1780 and precipitation data to 1786. Annual observations through 2025 were analysed using ordinary least-squares regression, with Newey–West heteroscedasticity- and autocorrelation-consistent estimates used to quantify uncertainty. Monthly temperature anomalies and seasonal trends were also examined to characterise how warming was distributed across the calendar year. Recent multidecadal trends were also compared with historical-reference distributions derived from detrended observations ending in 1949 by means of a moving-block bootstrap, and the temperature analysis was repeated across a range of regression-window lengths to assess sensitivity to the chosen timescale. Mean annual temperature rose by 0.09°C per decade over 1780–2025, compared with 0.67°C per decade over 2000–2025. For the latest 51-year period, 1975–2025, the estimated warming rate was 0.50°C per decade and lay above the historical-reference limits for every block length examined. All four seasons warmed significantly over 1975–2025, with estimated trends ranging from 0.35°C per decade in winter to 0.65°C per decade in summer. A global test indicated seasonal heterogeneity (p=0.038), although no individual pairwise difference remained significant after Holm correction. The full-record precipitation trend was positive, although this result was strongly affected by exceptionally dry conditions in the early nineteenth century. More recent precipitation trends were negative, but their confidence intervals included zero. The results therefore provide clear evidence of strong recent warming in Barcelona, whereas the direction of recent long-term precipitation change remains uncertain.
Keywords: Barcelona climate; homogenised climate series; temperature trends; seasonal temperature trends; precipitation variability; time-series analysis; Newey–West covariance; moving-block bootstrap.
Introduction
Long instrumental records are particularly valuable because they allow recent climatic changes to be viewed against a much wider background of interannual and multidecadal variability. Barcelona has reconstructed and homogenised monthly records of mean temperature beginning in 1780 and precipitation beginning in 1786. These are composite urban series assembled from observations collected at several sites, by different institutions and observers, rather than uninterrupted measurements from a single meteorological station (Prohom Duran et al., 2012; Prohom et al., 2016; Meteocat, 2026).
The Barcelona record also needs to be considered within the broader warming observed across Spain, Europe, and the world. According to the Spanish State Meteorological Agency (AEMET), mean annual temperature in Spain increased by 1.75°C between 1961 and 2025 (AEMET, 2026). Over roughly the past three decades, Europe has warmed at about 0.56°C per decade, more than twice the corresponding global rate of approximately 0.27°C per decade (C3S/ECMWF and WMO, 2026). Globally, the years 2015–2025 were the 11 warmest in the instrumental record, and the mean surface temperature in 2025 was approximately 1.43°C above the 1850–1900 average (WMO, 2026). These figures cannot be compared directly because they refer to different periods, geographical scales, baselines, and statistical measures. Taken together, however, they show that warming in Spain and Europe is part of a persistent global trend, with a particularly strong signal over European land.
Further warming is expected over the coming decades. For 2041–2060, the IPCC gives best estimates of approximately 1.6–2.4°C above the 1850–1900 mean across its five illustrative emissions scenarios (IPCC, 2021). In the Mediterranean region, annual warming is projected to exceed the global annual mean by about 20%, and summer warming by about 50%. Precipitation is also expected to decrease across much of the region, although the magnitude and seasonal pattern of that decline depend on future emissions (Ali et al., 2022).
Here, annual temperature and precipitation were analysed to quantify complete-record and recent trends, evaluate the uncertainty of the resulting estimates, characterise the monthly and seasonal distribution of temperature change, compare recent multidecadal trends with a historical reference distribution, and examine the sensitivity of estimated temperature trends to regression-window length.
Methods
Climate data and annual aggregation
Monthly temperature and precipitation observations through 2025 were taken from the reconstructed and homogenised historical climate series for Barcelona published by Meteocat (Meteocat, 2026). Annual mean temperature and total annual precipitation were calculated only when all 12 monthly observations were available. Before publication, the source series had undergone data rescue, quality control, reconstruction, and relative homogenisation to reduce discontinuities associated with changes in site, instrumentation, units, exposure, and observation practice (Prohom Duran et al., 2012; Prohom et al., 2016).
Monthly temperature-anomaly heat map
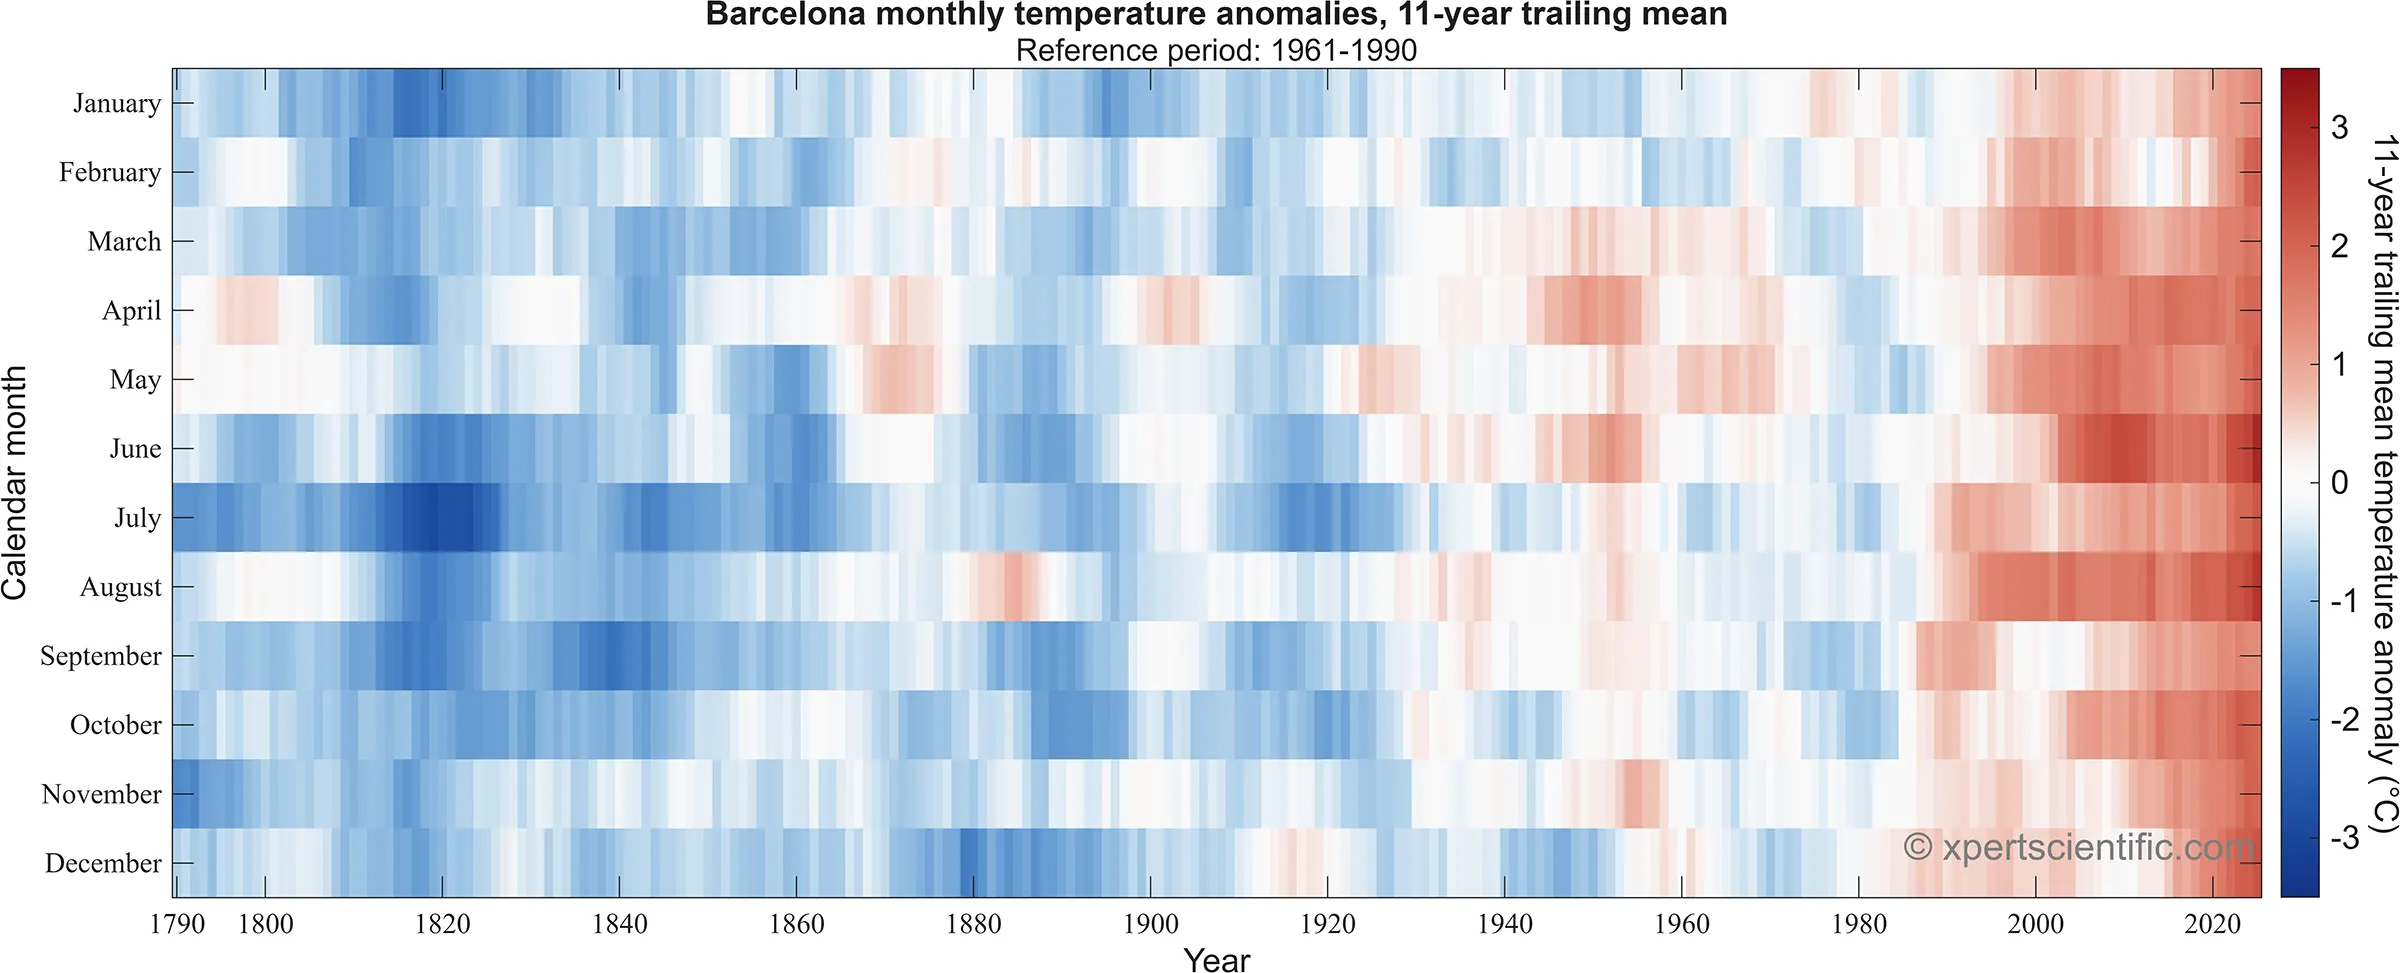
Monthly temperature anomalies were calculated relative to the 1961–1990 mean for the corresponding calendar month. To emphasise multidecadal rather than year-to-year variability, each calendar month was analysed separately using an 11-year trailing mean. The value assigned to a given year therefore represents the mean anomaly for that month over the 11-year period ending in that year. The resulting values were displayed as a heat map with calendar month on the vertical axis and year on the horizontal axis.
Trend estimation and uncertainty
Ordinary least-squares regressions with an intercept were fitted to the complete records and separately to 2000–2025. The year variable was centred before fitting to improve numerical conditioning, and the resulting slopes were multiplied by 10 so that all trends could be reported per decade. Regression uncertainty was estimated using Newey–West heteroscedasticity- and autocorrelation-consistent (HAC) covariance matrices (Newey and West, 1987; Newey and West, 1994). No prewhitening was applied. Bartlett weights were used, with the truncation lag defined as L = ⌊4(n/100)2/9⌋, subject to a minimum of 1 and a maximum of n − 1, where n is the number of annual observations. The covariance matrices were multiplied by the finite-sample correction n/(n − 2). The lag rule yielded L = 4 for the complete records, L = 2 for the 2000–2025 regressions, and L = 3 for each 51-year regression. Asymptotic 95% confidence intervals and two-sided Wald tests of a zero-trend null hypothesis were calculated using standard-normal critical values.
Changes over multidecadal timescales were examined with trailing 51-year regressions. Each slope was assigned to the final year of the interval from which it was calculated. Thus, the value plotted for 2025 represents the trend over 1975–2025. Pointwise 95% Newey–West HAC confidence intervals were obtained for each trailing estimate using the same procedure as for the fixed-period regressions.
Seasonal mean temperatures were calculated for winter (December–February; DJF), spring (March–May; MAM), summer (June–August; JJA), and autumn (September–November; SON) as the arithmetic mean of the three constituent monthly means, with all three monthly values required. Winter was assigned to the year containing January and February, so the first complete winter was 1781. Seasonal trends were estimated for the full common period 1781–2025 and for 1975–2025 using the same ordinary least-squares and Newey–West HAC procedure. The lag rule yielded L = 4 for 1781–2025 and L = 3 for 1975–2025.
Differences among seasonal warming rates were assessed using a multivariate HAC Wald test of the null hypothesis that all four seasonal slopes were equal. The joint covariance estimate accounted for both contemporaneous covariance among seasons and serial covariance across years. All six pairwise slope differences were then evaluated by applying the same HAC trend model to annual differences between seasonal temperatures. P values for the six pairwise comparisons within each analysis period were adjusted using the Holm procedure to control the family-wise error rate.
Historical-reference bootstrap
Historical-reference distributions were constructed separately for temperature and precipitation using annual observations through 1949. A linear trend was first removed from each reference series, after which the residuals were centred on zero. The cutoff at 1949 was chosen to provide a pre-1950 baseline while excluding most of the stronger warming that occurred later in the record.
A moving-block bootstrap was used to retain temporal dependence within the historical residuals (Künsch, 1989). Overlapping blocks of consecutive observations were sampled uniformly with replacement and joined together until a synthetic 51-year series had been formed; any excess observations were then discarded. This procedure was repeated 10,000 times for each of three block lengths: 5, 7, and 10 years. The range was chosen to test the sensitivity of the results to the preservation of dependence over multiannual to approximately decadal timescales, while keeping the blocks substantially shorter than the 51-year analysis window. The selected lengths were not intended to correspond to, or test for, specific climatic cycles.
A linear slope was fitted to every synthetic series. For each block length, the 2.5th and 97.5th percentiles of the resulting slope distribution defined the 95% historical-reference interval. Because there was no clear basis for selecting one block length as preferable, the plotted sensitivity envelope was defined by the lowest lower limit and the highest upper limit obtained from the three bootstrap analyses.
To make the bootstrap output repeatable, the calculations used a fixed Mersenne Twister base seed of 20260724. Separate deterministic seeds were assigned to each variable and block length. For temperature, the seed was the base value plus the block length; for precipitation, it was the base value plus 1000 and the block length.
Regression-window sensitivity analysis
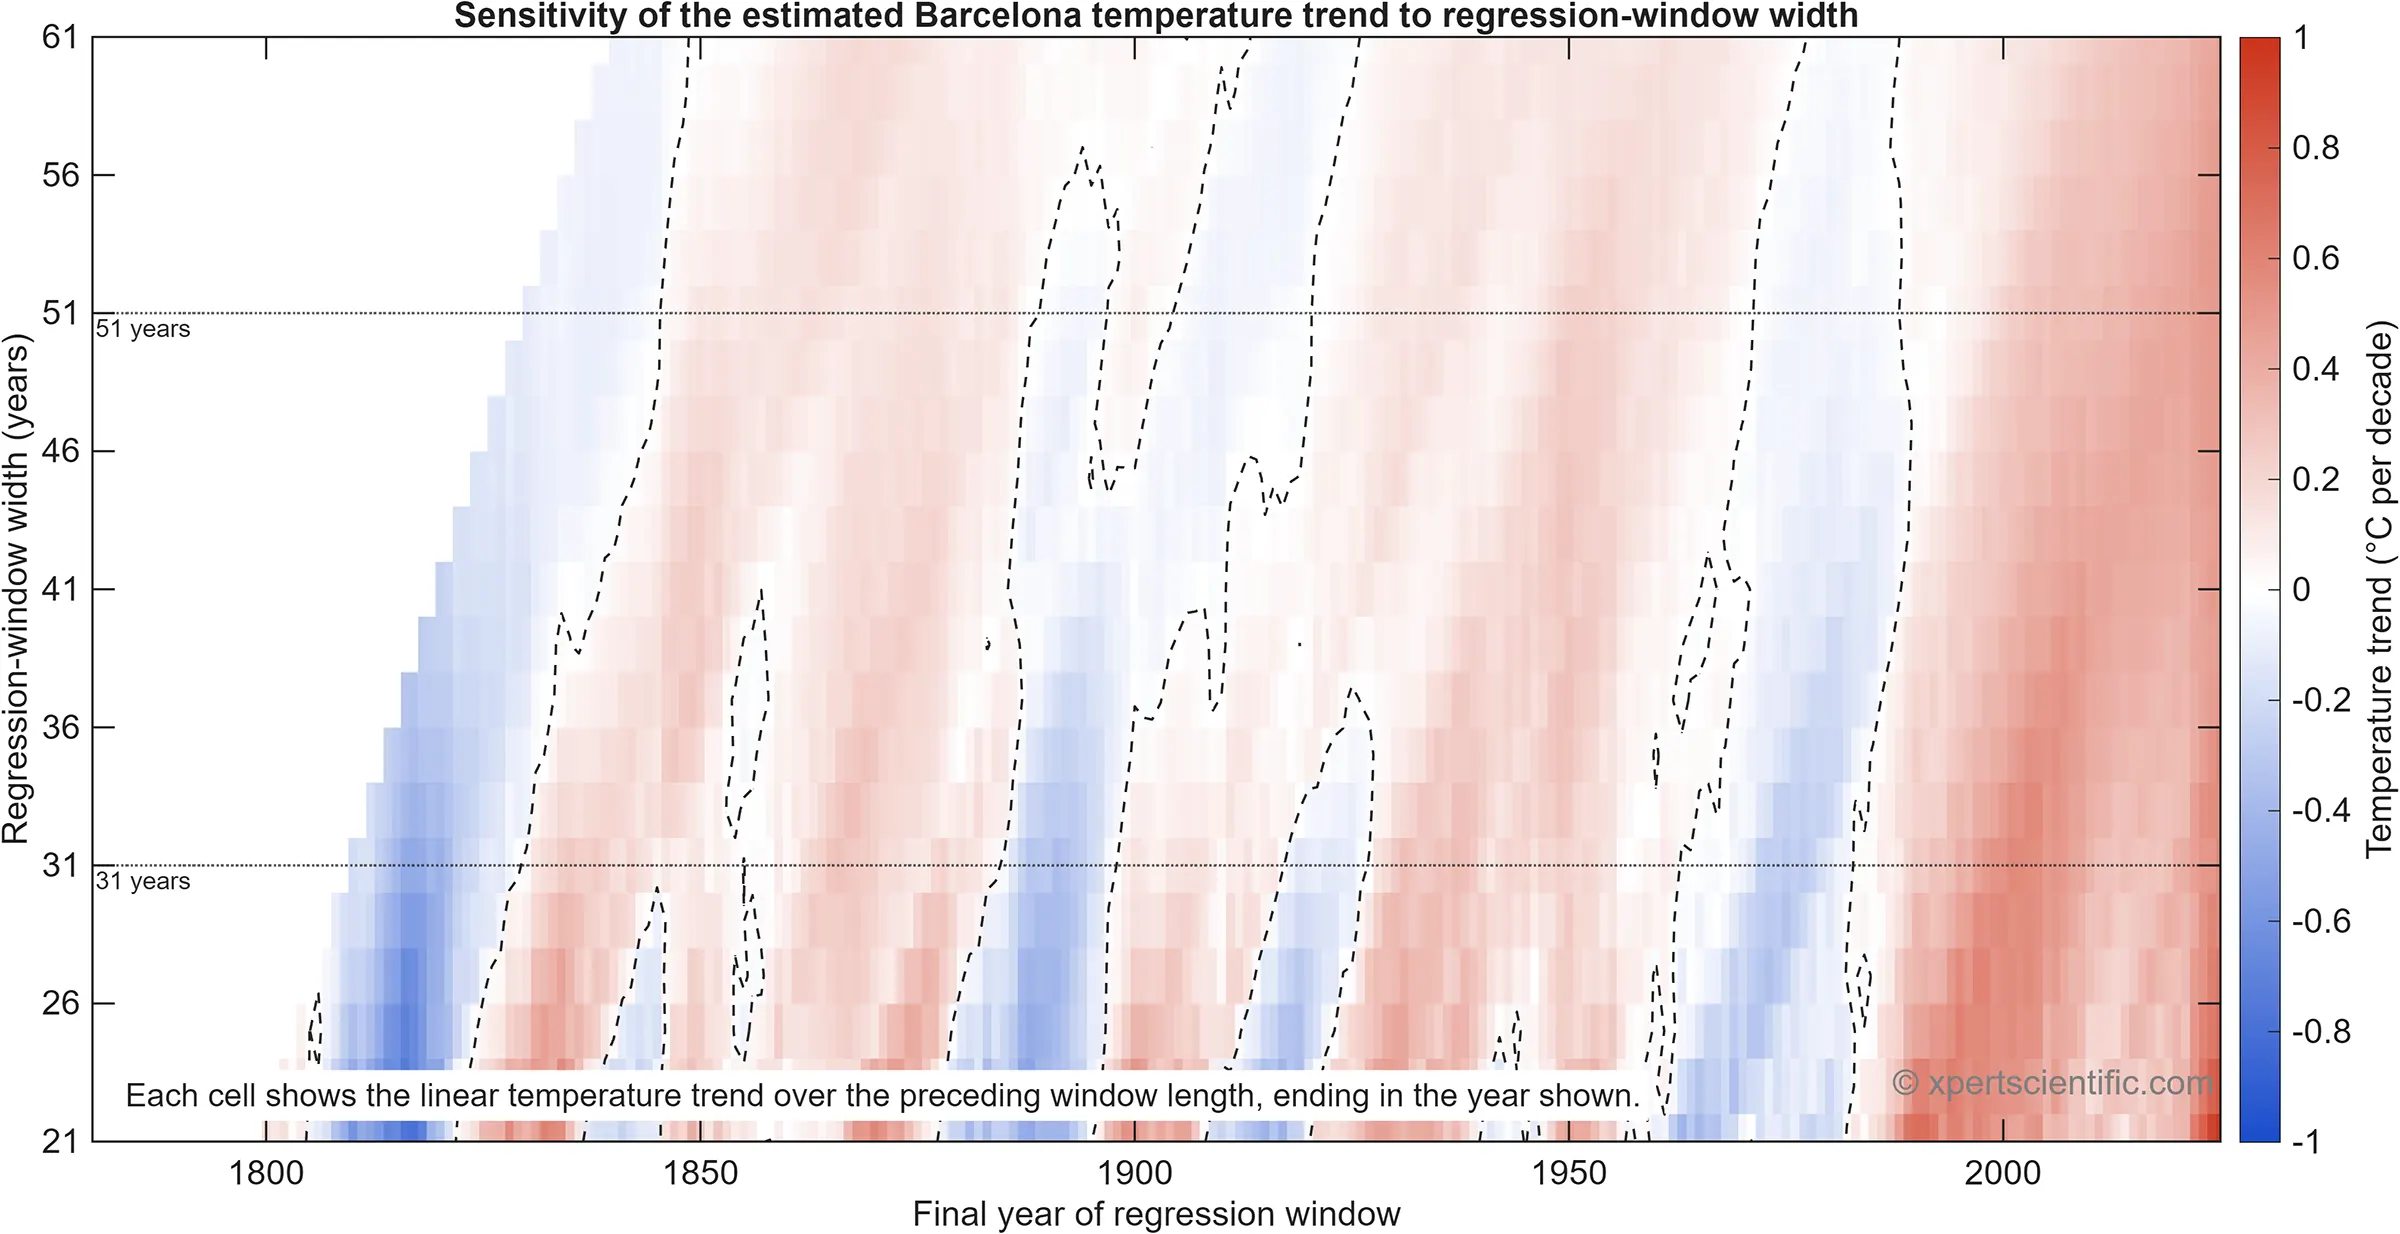
A separate analysis assessed the influence of regression-window length on the estimated temperature trend. Trailing regressions were calculated for every odd-numbered window from 21 to 61 years, including the 31- and 51-year windows. As in the 51-year analysis, each estimate was assigned to the final year of its regression interval. The resulting slopes were displayed as a heat map showing their direction and magnitude; the heat map does not indicate statistical significance.
Results
Fixed-period temperature and precipitation trends
Mean annual temperature increased by 0.09°C per decade over the full 1780–2025 record (HAC standard error, 0.01°C per decade; 95% confidence interval, +0.06 to +0.11°C per decade; p<0.001) (Figure 1). The trend estimated for 2000–2025 was much steeper, at 0.67°C per decade (HAC standard error, 0.17°C per decade; 95% confidence interval, +0.34 to +1.00°C per decade; p<0.001). Most of the highest annual values occurred towards the end of the series. The recent period therefore shows substantially faster warming than the complete-record average, although no formal test was carried out to determine whether the two slopes differ significantly.
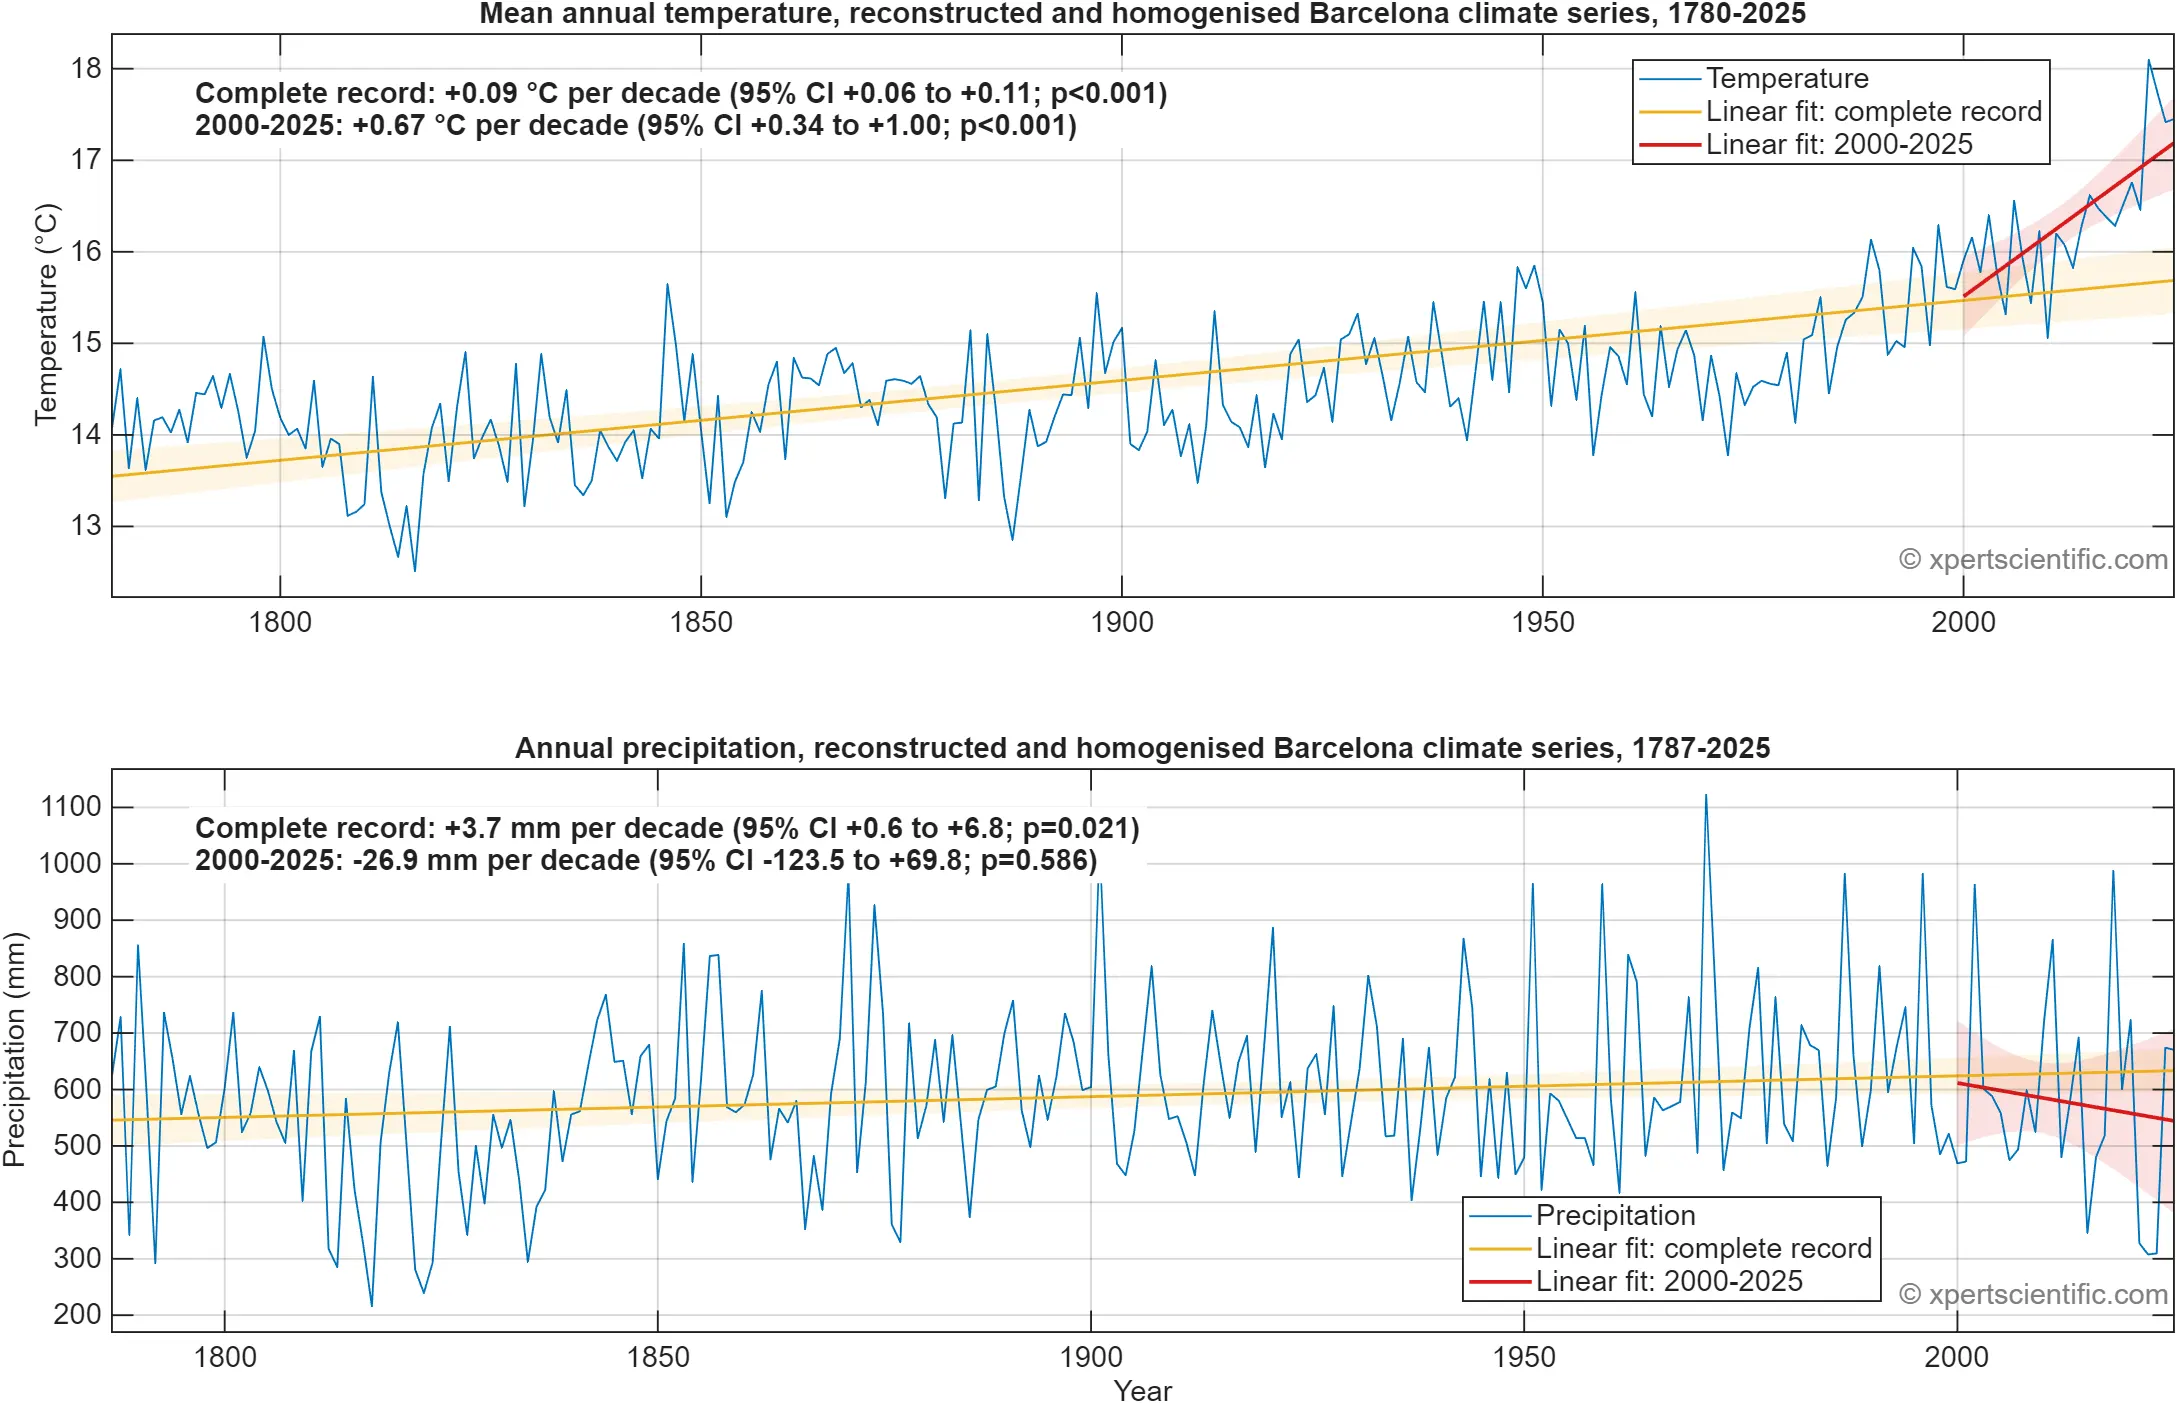
Annual precipitation exhibited pronounced interannual variability (Figure 1). Across 1787–2025, the estimated trend was +3.7 mm per decade (HAC standard error, 1.6 mm per decade; 95% confidence interval, +0.6 to +6.8 mm per decade; p=0.021). This positive slope does not represent a steady increase throughout the record. It is strongly influenced by exceptionally dry conditions in the first half of the nineteenth century, including the prolonged drought of approximately 1808–1835 (Prohom et al., 2016). For 2000–2025, the estimated trend was −26.9 mm per decade, but the uncertainty was substantial (HAC standard error, 49.3 mm per decade; 95% confidence interval, −123.5 to +69.8 mm per decade; p=0.586). The estimate was therefore not statistically distinguishable from zero. This is consistent with the original precipitation study, which attributed the significant full-period increase to the low values recorded in the early nineteenth century and found no significant trends from the mid-nineteenth century onward (Prohom et al., 2016).
Seasonal evolution of temperature anomalies
The monthly anomaly heat map shows pronounced multidecadal changes in the seasonal distribution of temperature anomalies (Figure 2). Because anomalies are expressed relative to the 1961–1990 reference period, 11-year mean anomalies are predominantly negative during much of the nineteenth and early twentieth centuries, interspersed with shorter periods of relative warmth. From approximately the late twentieth century onward, positive anomalies increasingly dominate and become more persistent across the calendar year, with particularly strong positive anomalies in several late-spring and summer months during recent decades.
Seasonal regressions confirmed significant warming in all four seasons over both analysis periods (Table 1). Over 1781–2025, estimated trends ranged from +0.07°C per decade in winter to +0.11°C per decade in summer. Over 1975–2025, the corresponding trends were substantially steeper, ranging from +0.35°C per decade in winter to +0.65°C per decade in summer; spring and autumn warmed by +0.51°C and +0.47°C per decade, respectively.
The seasonal slopes differed significantly among seasons over the full common record (Wald χ²(3) = 16.09; p=0.001). After Holm correction, summer warmed significantly faster than winter and spring (adjusted p=0.002 for both comparisons), whereas the summer–autumn contrast narrowly missed the 0.05 threshold (adjusted p=0.051). Seasonal heterogeneity was also detected over 1975–2025 (Wald χ²(3) = 8.41; p=0.038), but none of the six pairwise contrasts remained significant after adjustment. The strongest recent contrast was summer versus winter, with a difference of +0.30°C per decade (Holm-adjusted p=0.059).
| Season | 1781–2025 trend, °C/decade (95% CI) | 1975–2025 trend, °C/decade (95% CI) |
|---|---|---|
| Winter (DJF) | +0.07 (+0.05 to +0.10) | +0.35 (+0.13 to +0.57) |
| Spring (MAM) | +0.08 (+0.05 to +0.10) | +0.51 (+0.40 to +0.61) |
| Summer (JJA) | +0.11 (+0.08 to +0.15) | +0.65 (+0.47 to +0.82) |
| Autumn (SON) | +0.09 (+0.06 to +0.11) | +0.47 (+0.29 to +0.64) |
Trailing 51-year trends and historical-reference comparison
The trailing 51-year temperature trends moved between periods of warming and cooling over much of the record (Figure 2). For the latest interval, 1975–2025, the estimated trend was +0.50°C per decade (HAC standard error, 0.06°C per decade; 95% confidence interval, +0.38 to +0.61°C per decade; p<0.001). This value lay above the upper 95% bootstrap limit for all three block lengths. The conclusion that the latest 51-year warming trend is unusually large relative to the detrended pre-1950 reference series was therefore unchanged across the tested block-length choices.
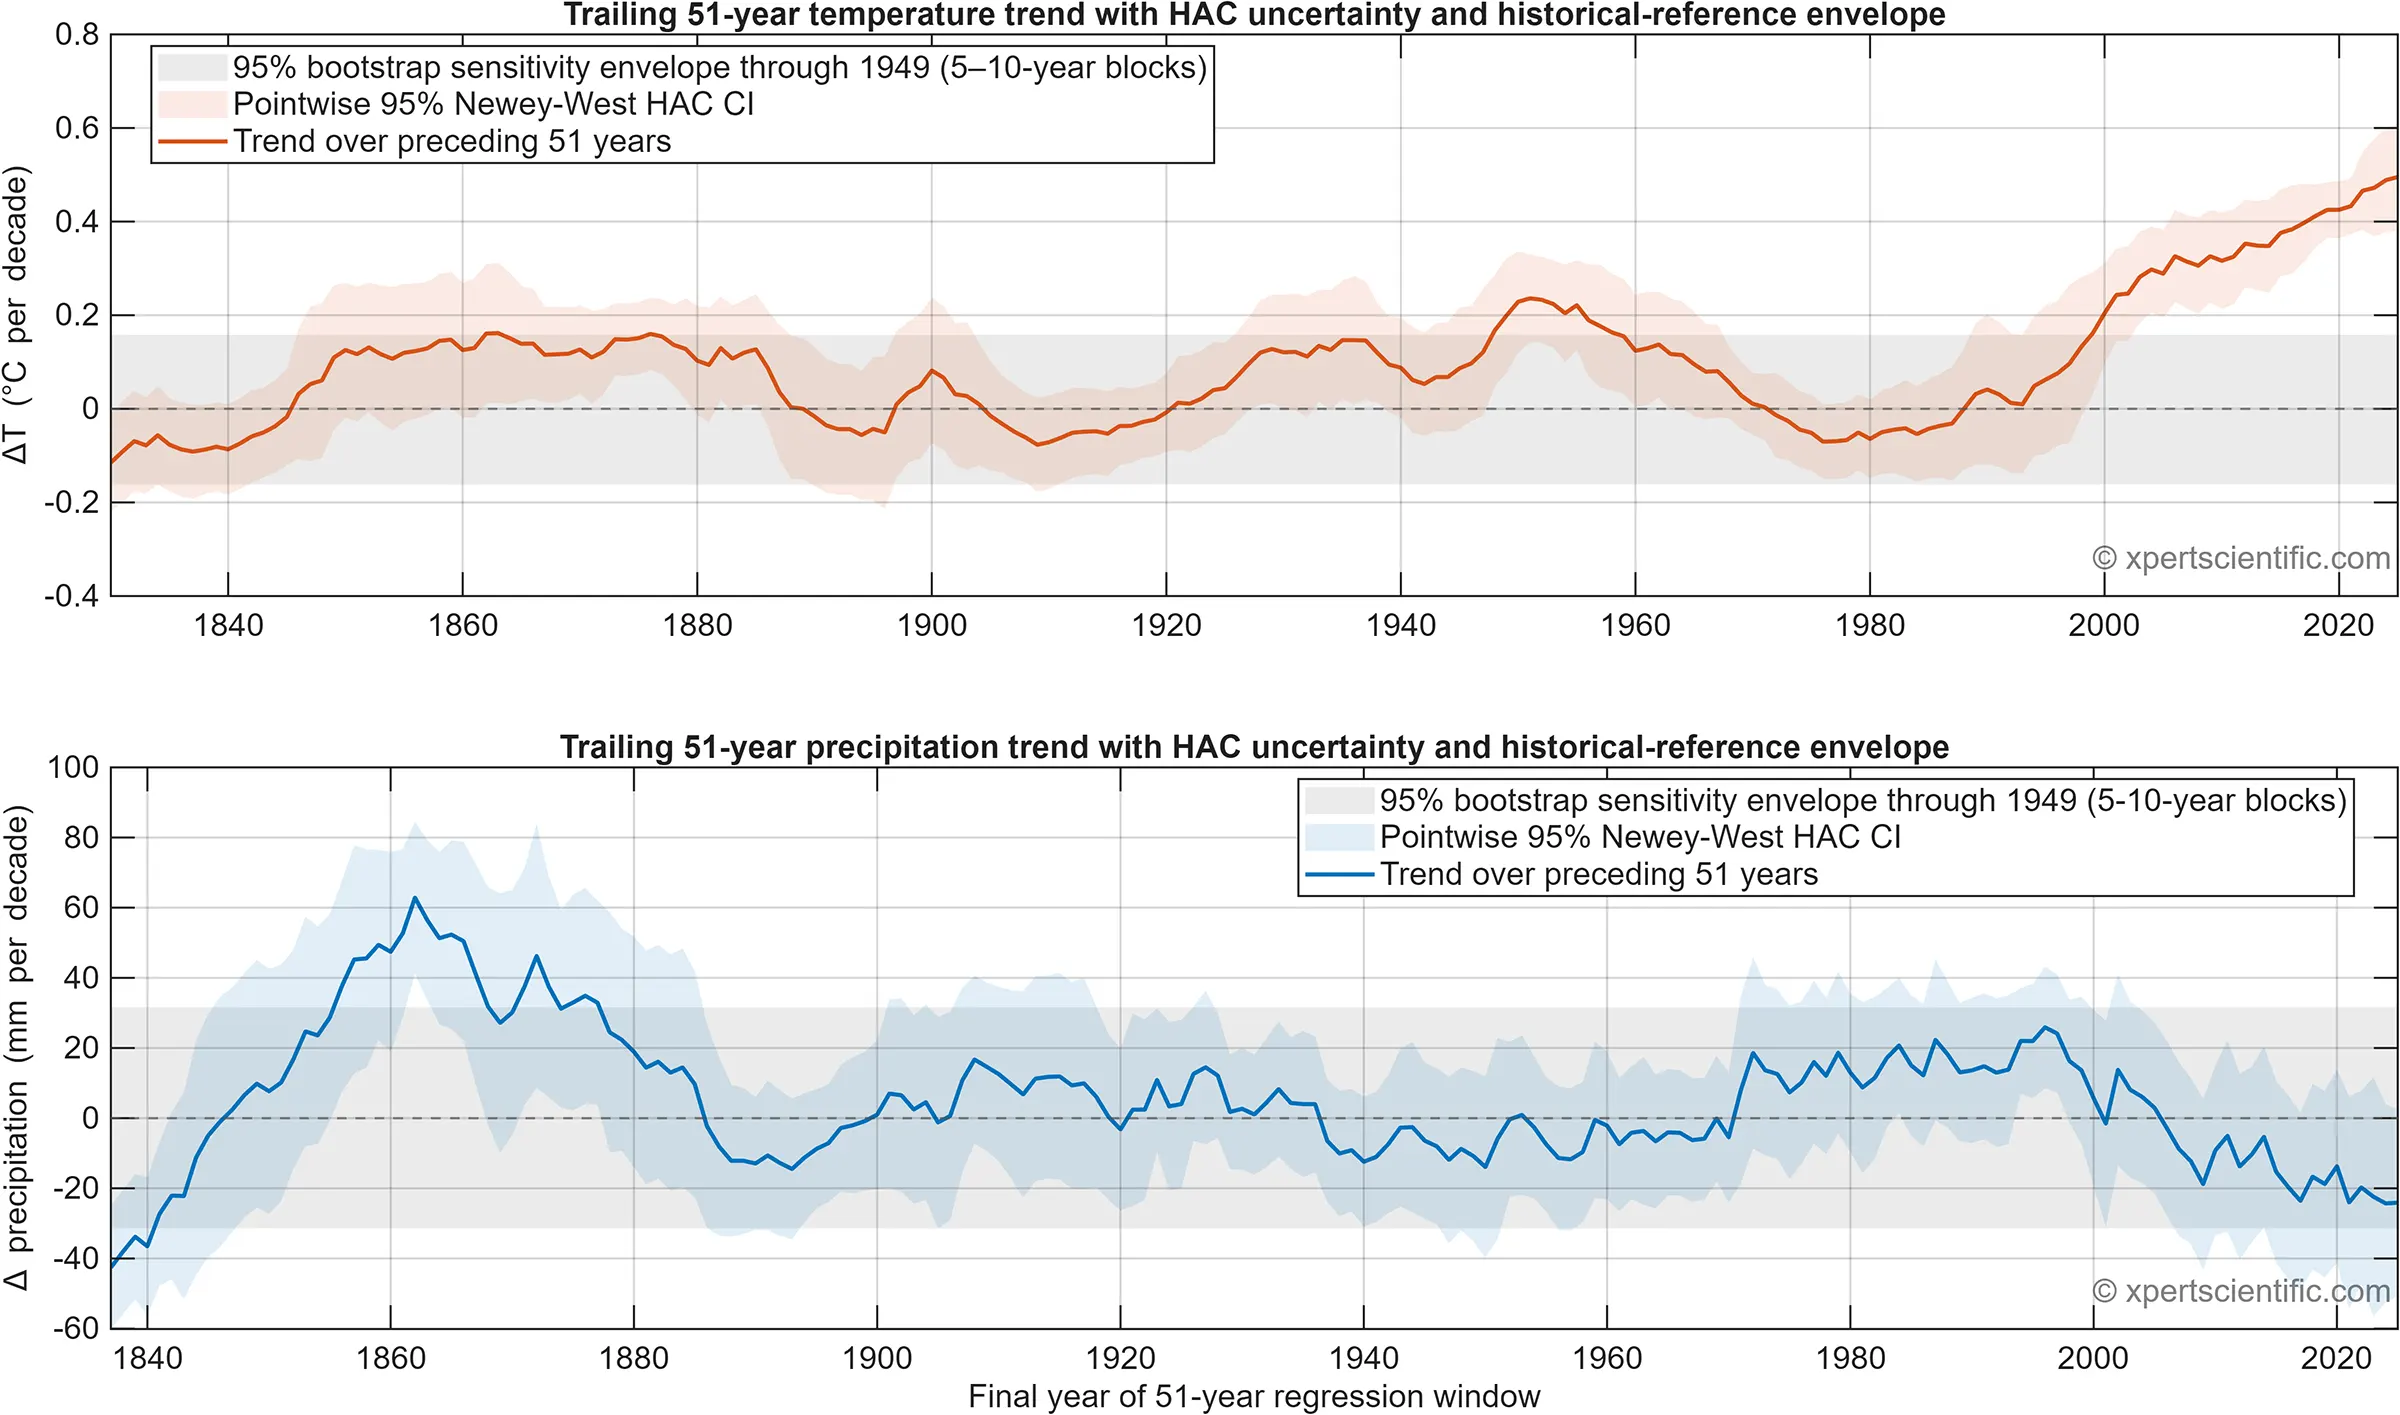
For precipitation, the corresponding 1975–2025 trend was −24.1 mm per decade (HAC standard error, 13.6 mm per decade; 95% confidence interval, −50.8 to +2.6 mm per decade; p=0.077). The estimate remained inside the bootstrap envelope for each block length. In view of the broad confidence interval, the pronounced year-to-year variability, and the absence of a statistically significant trend, there is no strong evidence that recent multidecadal precipitation change falls outside the range represented by the historical reference series.
Sensitivity to regression-window length
The estimated temperature trend also depended on the length of the regression window (Figure 3). Short windows produced larger and more rapidly changing positive and negative slopes, while longer windows smoothed much of this variation and highlighted lower-frequency change. As a result, the timing and magnitude of individual peaks, pauses, and reversals varied with the selected timescale. Even so, relatively strong positive trends appeared near the end of the record across a wide range of window lengths.
Discussion
Temperature trends in context
The reconstructed Barcelona temperature series shows clear evidence of pronounced recent warming. Over the complete record, the estimated trend of +0.09°C per decade is close to the +0.07°C per decade reported by Prohom Duran et al. (2012) for 1780–2011. Extending the series through 2025 adds several exceptionally warm recent years and produces a slightly higher full-period estimate. The result is also comparable in magnitude to the mean trend of +0.10°C per decade reported for mainland Spain over 1850–2005, although the two estimates refer to different periods, geographical scales, and observational datasets (Brunet et al., 2007). The strongest evidence comes from the latest 51-year interval: the 1975–2025 trend was positive, statistically significant, and above the historical-reference envelope for every bootstrap block length tested.
The monthly and seasonal analyses show that the recent warming is not confined to a single part of the year. Positive anomalies have become increasingly persistent across the calendar year, while summer had the largest seasonal trend estimate over both the full record and 1975–2025. Over the full record, summer warmed significantly faster than winter and spring after adjustment for multiple comparisons. For 1975–2025, the global test indicated overall seasonal heterogeneity, but the pairwise contrasts were less conclusive: none remained significant after Holm correction, although the summer–winter difference was close to the adjusted 0.05 threshold. The seasonal ranking should therefore be interpreted as evidence of a stronger summer tendency rather than as proof that all recent seasonal warming rates are distinct.
The multi-window analysis demonstrates that the detailed temporal evolution of the estimated warming rate depends on the timescale considered. Shorter regressions are more responsive to multidecadal fluctuations and to the observations entering or leaving the ends of the window, whereas longer regressions provide more stable but more strongly smoothed estimates. Individual peaks, pauses, or reversals in one trailing-trend curve should therefore not be interpreted as unique climatic change points. The robust result is the persistence of strong recent warming across a wide range of window lengths.
Interpretation of precipitation trends
The precipitation results are less conclusive. The positive slope over the complete record is strongly shaped by the exceptional drought of the early nineteenth century, and the original source study found no significant annual trend over later subperiods (Prohom et al., 2016). Although the estimates for both 2000–2025 and 1975–2025 were negative, their confidence intervals included zero. The latest 51-year trend also remained within every bootstrap envelope examined. The precipitation series therefore points to substantial temporal variability, but it does not provide clear evidence of a resolved recent long-term trend.
Limitations
Several limitations affect the interpretation of these results. The source data are a reconstructed and homogenised urban composite assembled from observations made at different locations and under changing instrumental and observational conditions. Homogenisation can reduce such discontinuities, but it cannot remove all associated uncertainty. This is especially relevant before approximately 1840, when suitable neighbouring reference series are sparse (Prohom Duran et al., 2012).
From 1913 onward, the temperature series is based on observations from Fabra Observatory. Its stable setting and elevated location, approximately 412 m above sea level and outside the densely built city centre, make it less likely that the recent warming signal is primarily an artefact of local urbanisation. Residual local environmental influences cannot, however, be ruled out entirely.
The statistical analysis also has limitations. Linear regression provides an average rate of change over a selected interval and does not describe every feature of the underlying trajectory. Adjacent trailing windows overlap extensively and are therefore not statistically independent. Their confidence intervals are pointwise and do not account for multiple comparisons across years or window lengths. The 11-year monthly anomaly heat map likewise uses strongly overlapping trailing means, so adjacent cells should be interpreted as a smoothed visual summary rather than independent observations. Seasonal trend comparisons depend on the selected analysis periods and the linear-trend assumption, although the pairwise tests were adjusted for multiplicity using the Holm procedure. The bootstrap envelope also depends on the chosen reference period, detrending model, and block lengths, as well as on the assumption that the dependence structure of the historical residuals remains relevant later in the record. The results should therefore be regarded as a descriptive analysis of the Barcelona series rather than as a formal exercise in climatic detection, attribution, or regionalisation.
Data availability
Monthly mean temperature and monthly accumulated precipitation data were obtained from the Meteocat historical climate series for Barcelona (Meteocat, 2026) and accessed in July 2026. The source data are publicly available under the Creative Commons Attribution 4.0 International licence. The present analysis used observations through December 2025.
Analysis software and code availability
Annual and seasonal aggregation, monthly anomaly calculations, linear trend estimation, Newey–West uncertainty calculations, multivariate and pairwise seasonal slope tests, Holm adjustment, moving-block bootstrap analyses, and graphical output were produced in MATLAB R2025a. The analytical code and associated workflow are proprietary to XpertScientific and are not publicly distributed. The methods and parameter settings are described in sufficient detail to permit independent implementation and evaluation of the analysis.
Suggested citation:
Ross O.N. (2026). Long-term temperature and precipitation trends in the reconstructed Barcelona climate series (1780–2025). XpertScientific Scientific Data Analysis Case Study. Barcelona: XpertScientific. DOI: 10.5281/zenodo.22099932.
Available from https://xpertscientific.com/barcelona-climate-data-analysis-case-study/.
References
- AEMET. (2026). "Informe sobre el estado del clima de España 2025." Retrieved July, 2026, from https://www.aemet.es/es/conocermas/recursos_en_linea/publicaciones_y_estudios/publicaciones/detalles/informe_estado_clima.
- Ali, E., Cramer, W., Carnicer, J., Georgopoulou, E., Hilmi, N. J. M., Le Cozannet, G. and Lionello, P. (2022). "Cross-Chapter Paper 4: Mediterranean Region". Climate Change 2022: Impacts, Adaptation and Vulnerability. H.-O. Pörtner, D. C. Roberts, M. Tignor et al., Eds. Cambridge, United Kingdom and New York, NY, USA, Cambridge University Press: 2233-2272. DOI: 10.1017/9781009325844.021.
- Brunet, M., Jones, P. D., Sigró, J., Saladié, O., Aguilar, E., Moberg, A., Della-Marta, P. M., Lister, D., Walther, A. and López, D. (2007). "Temporal and spatial temperature variability and change over Spain during 1850–2005." Journal of Geophysical Research: Atmospheres 112(D12):D12117. DOI: 10.1029/2006JD008249.
- C3S/ECMWF and WMO (2026). "C3S-WMO European State of the Climate 2025." DOI: 10.24381/zy93-sb27.
- IPCC (2021). "Climate Change 2021: The Physical Science Basis." Contribution of Working Group I to the Sixth Assessment Report of the Intergovernmental Panel on Climate Change. Cambridge University Press, Cambridge, United Kingdom and New York, NY, USA. DOI: 10.1017/9781009157896.
- Künsch, H. R. (1989). "The Jackknife and the Bootstrap for General Stationary Observations." The Annals of Statistics 17(3):1217-1241. DOI: 10.1214/aos/1176347265.
- Meteocat. (2026). "Serie climatica de Barcelona des de 1780." Retrieved July, 2026, from: https://www.meteo.cat/wpweb/climatologia/dades-i-productes-climatics/serie-climatica-de-barcelona-des-de-1780/.
- Newey, W. K. and West, K. D. (1987). "A Simple, Positive Semi-Definite, Heteroskedasticity and Autocorrelation Consistent Covariance Matrix." Econometrica 55(3):703-708. DOI: 10.2307/1913610.
- Newey, W. K. and West, K. D. (1994). "Automatic Lag Selection in Covariance Matrix Estimation." The Review of Economic Studies 61(4):631-653. DOI: 10.2307/2297912.
- Prohom Duran, M., Barriendos Vallvé, M., Aguilar Anfrons, E. and Ripoll Pi, R. (2012). "Recuperación y análisis de la serie de temperatura diaria de Barcelona, 1780-2011." Cambio Climático. Extremos e Impactos, Asociación Española de Climatología, Serie A 8:207-217.
- Prohom, M., Barriendos, M. and Sanchez-Lorenzo, A. (2016). "Reconstruction and homogenization of the longest instrumental precipitation series in the Iberian Peninsula (Barcelona, 1786-2014)." International Journal of Climatology 36(8):3072-3087. DOI: 10.1002/joc.4537.
- WMO (2026). "State of the Global Climate 2025." World Meteorological Organization, Geneva, Switzerland. DOI: 10.59327/WMO/S/CRI/SOC/1.


 Make a Payment


 Buy Credit